Technical indicators
Charts always have a story to tell. However, from time to time those charts may be speaking a language you do not understand and you may need some help from an interpreter. Technical indicators are the interpreters of the Forex market. They look at price information and translate it into simple, easy-to-read signals that can help you determine when to buy and when to sell a currency pair.
Technical indicators are divided into the following categories:
-
Trending indicators
-
Oscillatoring indicators
Trending indicators
Trending indicators, as their name suggests, identify and follow the trend of a currency pair. Forex traders make most of their money when currency pairs are trending. It is therefore crucial for you to be able to determine when a currency pair is trending and when it is consolidating. If you can enter your trades shortly after a trend begins and exit shortly after the trend ends, you will be quite successful.
Let`s take a look at the following trending indicators:
-
Moving Average
-
Bolinger bands
Moving Average
Moving averages are the most basic trending indicator. They show you what direction a currency pair is going and where potential levels of support and resistance may be — moving averages themselves can serve as both support and resistance.
As we discuss moving averages, we will look at the following three topics:
How moving averages are constructed
Moving averages are constructed by finding the average closing price of a currency pair at any given time and then plotting these points on a price chart. The result gives you a smooth line that follows the price movement of the currency pair (9. Graphic).
You can adjust the volatility of a moving average by adjusting the time frame the indicator looks at to obtain the average price. Moving averages that look at fewer time periods to determine an average are more volatile. Moving averages that look at more time periods to determine an average are less volatile.
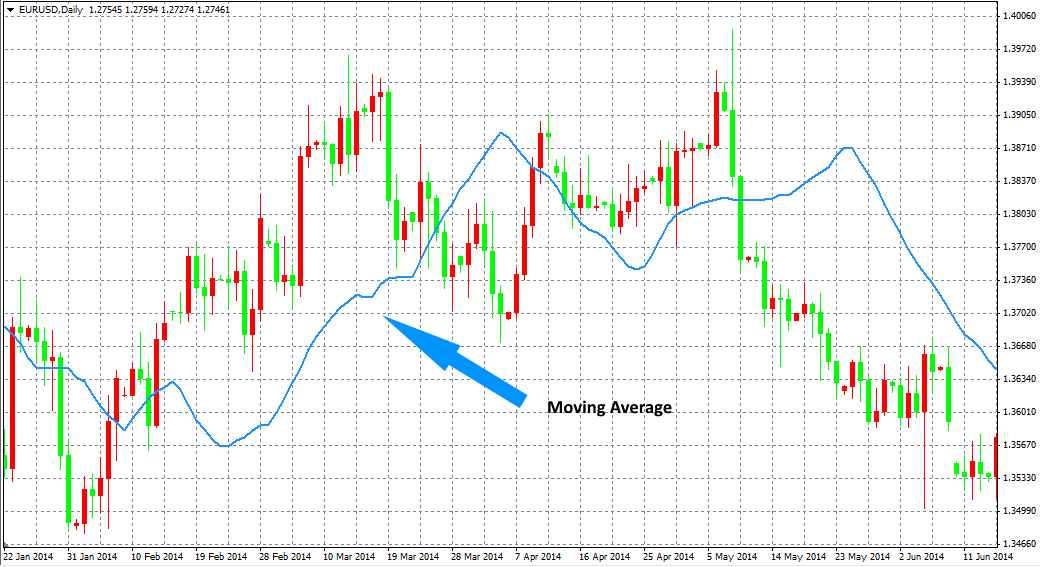
Graphic 9 - Moving Average
Strengths of a Moving Average
Moving average enjoy the following strengths:
-
They identify simple trends.
-
They are flexible enough to work in both short-term and long term time frames.
Weaknesses of Moving Average (MA)
-
It follows the market with some delay. The data for the calculations are historical, which is not always an indication of what can be expected in the future.
-
In consolidating and channeling markets can not give clear levels of support and resistance.
Bollinger bands
Bollinger bands, created by John Bollinger, are a trending indicator that can show you not only what direction a currency pair is going but also how volatile the price movement of the currency pair is. Bollinger bands consist of two bands—an upper band and a lower band—and a moving average and are generally plotted on top of the price movement of a chart.
As we discuss Bollinger bands, we will look at the following topics:
How Bollinger bands are constructed?
Bollinger bands are typically based on a 20-period moving average. This moving average runs through the middle of the two bands. The upper band is plotted two standard deviations above the 20-period moving average. The lower band is plotted two standard deviations below the 20-period moving average (Graphic 10).
Therefore 20-period Bollinger bands tell you how wide, or volatile, the range of closing prices has been during the past 20 periods. The more volatile the currency pair, the wider the bands will be. The less volatile the currency pair, the narrower the bands will be.
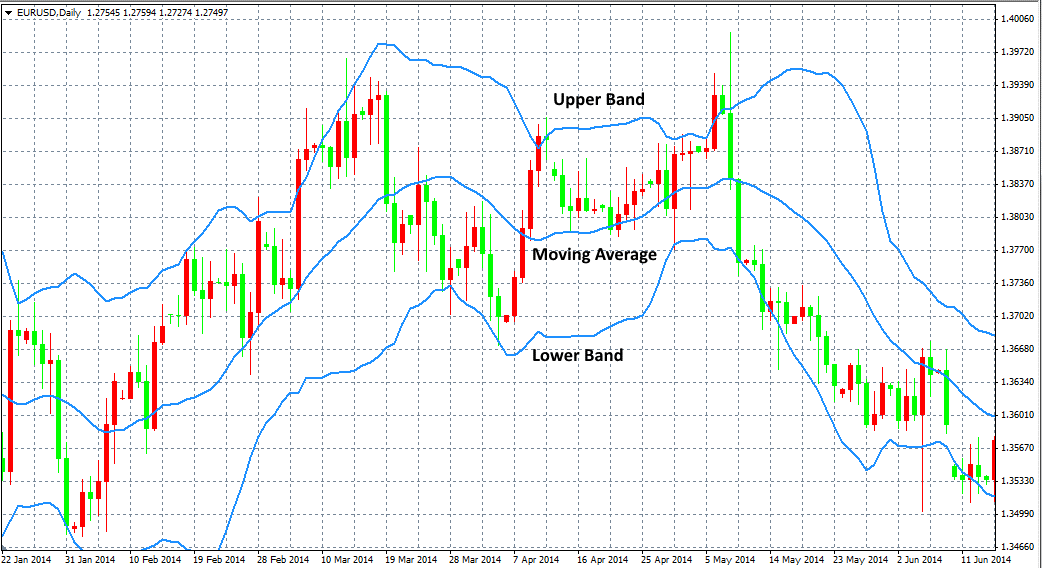
Graphic 10– Bollinger bands
Bollinger band trading signal
Bollinger bands provide useful breakout signals for currency pairs that have been consolidating.
Entry signal – when the bands widen and begin moving in opposite directions after a period of consolidation, you can enter the trade in the direction the price was moving when the bands began to widen.(11. Grafiğin A noktasına bakın).
Exit signal– when the band narrows theprice of the currency pair moved away from the breakout turns (11. Grafiğin B noktasına bakın). and starts moving back toward the current price of the currency pair, set a trailing stop loss to take you out of the trade if the trend reverses.( 11. Grafiğin C noktasına bakın).
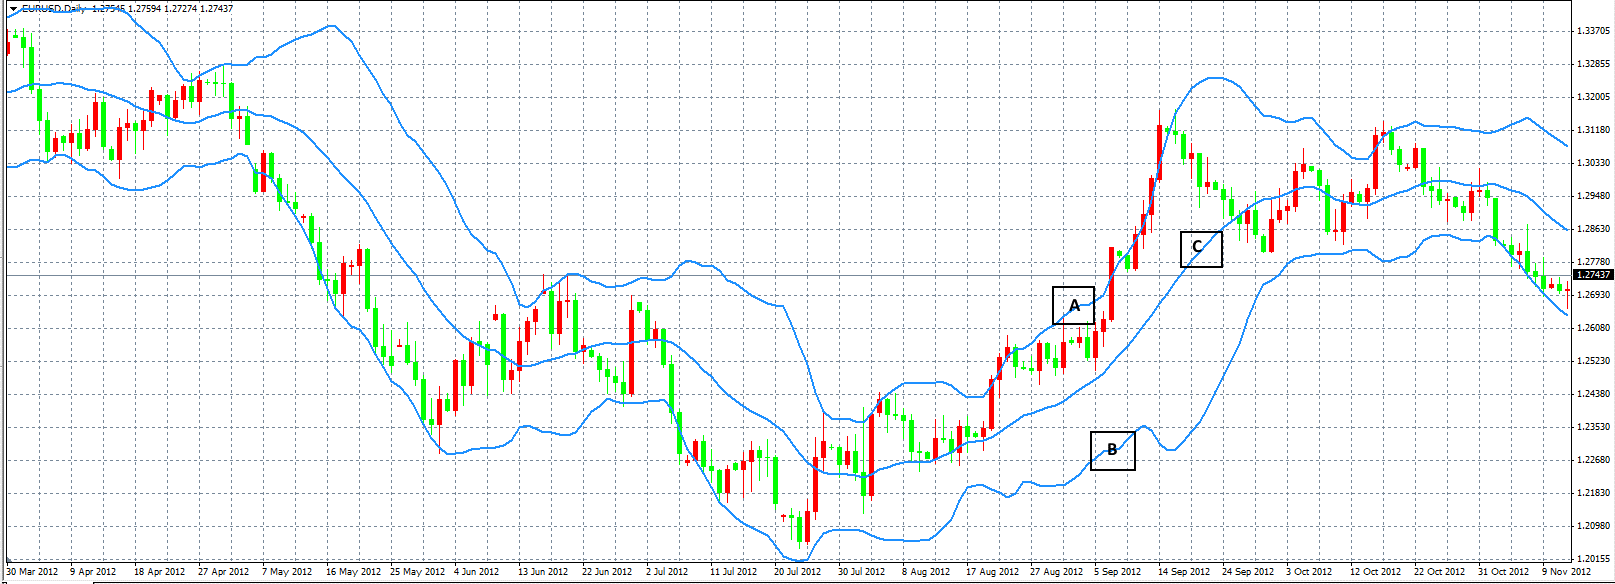
Graphic 11 - Bollinger bands
Strengths of Bollinger bands
-
They help you identify the trend.
-
They identify current market volatility.
Weaknesses of Bollinger Bands (BB)
-
Follows the market price with a certain lag. The data for the the calculation are historical, which is not alwasys an indication of what can be expected in the future.
-
The two lines, contrary to the popular belief, does not represent levels of support and resistance.
Oscillating indicators
Oscillating indicators, as their name suggests, are indicators that move back and forth as currency pairs rise and fall. Oscillating indicators can help you determine how strong the current trend of a currency pair is and when that trend is in danger of losing momentum and turning around.
Let`s take a look at the following oscillating indicators:
- Commodity channel index (CCI)
- Moving average convergence divergence (MACD)
Commodity channel index (CCI)
The commodity channel index (CCI) is an oscillating indicator developed by Donald Lambert that can show you how bullish or bearish traders are toward a currency pair and how dramatic those sentiments are. You can see the volatility of a currency pair with the CCI, much like you can with Bollinger bands. The CCI is usually plotted below the price movement on a chart.
How the CCI is constructed?
The commodity channel index (CCI) is based on both the average value of past price movements and how far those price movements have strayed from the average—how volatile the price movements have been.
If the average price of the currency pair is moving higher, the CCI will also be moving higher. Just how quickly the CCI moves higher depends on how volatile the currency pair is. If it is more volatile, the CCI will move higher faster. If it is less volatile, the CCI will move higher slower.
If the average price of the currency pair is moving lower, the CCI will also be moving lower. Just how quickly the CCI moves lower depends on how volatile the currency pair is. If it is more volatile, the CCI will move lower faster. If it is less volatile, the CCI will move lower slower.
The CCI moves back and forth, crossing 100, zero and -100 as it cycles through its progression.
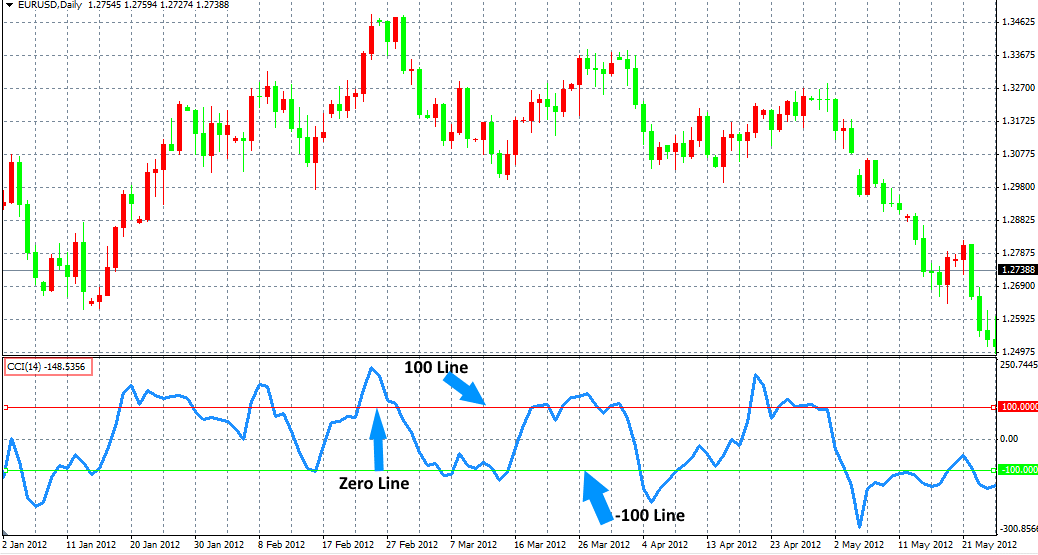
Graphic 12 – Commodity Channel Index (CCI)
Strengths of CCI
- It helps you identify volatility in a currency pair.
- It helps you identify potential reversal points for a currency pair.
- It helps you confirm the strength of current trends.
Weaknesses of CCI
- Lags behind the market, because the data for the calculation of CCI are historical, which is not always an indication of what can be expected in the future.
- Can not guarantee the points of reversal of the currency pair.
Moving Average Convergence/Divergence (MACD)
The moving average convergence divergence (MACD) is an oscillating indicator developed by Gerald Appel that can show you when trading momentum changes from being bullish to bearish and from being bearish to bullish. The MACD can also show you when traders are becoming over- extended, which usually results in a trend reversal for the currency pair.
The MACD is usually plotted below the price movement on a chart.
How the MACD is constructed?
The moving average convergence divergence is constructed based on a series of moving averages and how they relate to one another. The standard MACD looks at the relationship between a currency pairs 12-period and 26-period exponential moving average.Specifically, the MACD looks at the distance between these two moving averages.
If the 12-period moving average is above the 26-period moving average, the MACD line will be positive. If the 12-period moving average is below the 26-period moving average, the MACD line will be negative. The MACD line is accompanied by a trigger line. This line is a 9-period exponential moving average of the MACD line.
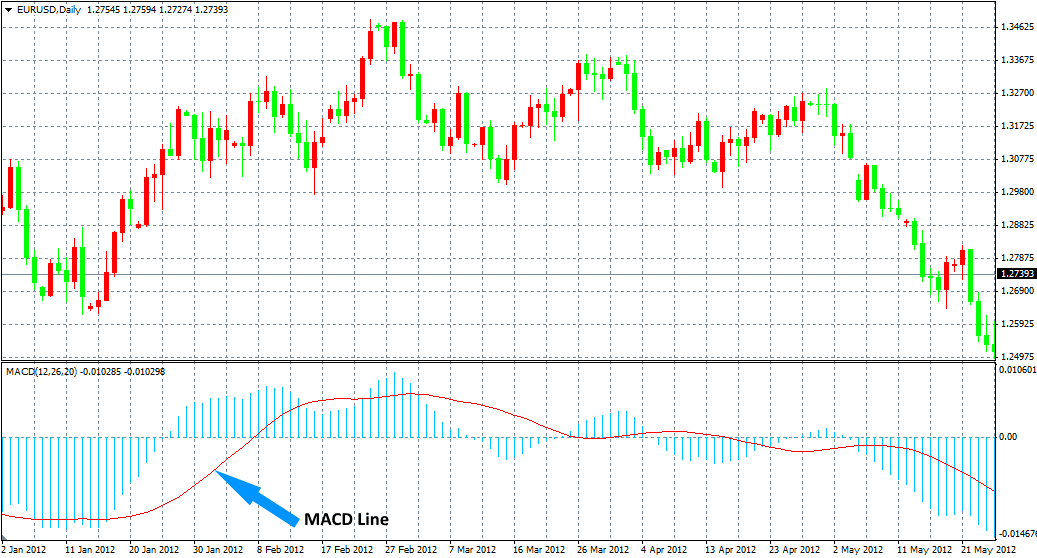
Graphic 13 - Moving Average Convergence/Divergence (MACD)
MACD Trading signals
The moving average convergence divergence (MACD) produces trading signals as it crosses back and forth above and below the trigger line.
Entry signal – when the MACD crosses above the trigger line, you can buy the currency pair knowing that momentum has shifted from being bearish to being bullish .
When the MACD crosses below the trigger line, you can sell the currency pair knowing that momentum has shifted from being bullish to being bearish.
Exit signal – when the MACD crosses back below the trigger line when you have bought the currency pair, you can sell the currency pair back knowing that momentum has shifted back from being bullish to being bearish.
When the MACD crosses back above the trigger line when you have sold the currency pair, you can buy the currency pair back knowing that momentum has shifted back from being bearish to being bullish.
Strengths of MACD
- It helps you identify when the momentum of currency pair changes.
- It helps you confirm the strengths of current trends.
Weaknesses of MACD
- Lags behind the market, because the data for the calculation of MACD are historical, which is not always an indication of what can be expected in the future.
- Can generate false signals.